
Merging Art and Information
A conversation with data visualization designer, Shirley Wu
Shirley Wu builds beautiful, informative data visualizations for companies and publications, and is the co-author of Data Sketches, a book of 24 experimental visualization projects.
Note: This interview has been edited for length and clarity

Your educational background is in business. Was there a specific turning point for you when you realized you wanted to take your career in a more artistic direction?
Let’s start a little bit before university because I think that would give context. When growing up, there were two things I really loved in terms of school. One was all of my math classes. I loved how logical they were and how much it made sense to me and that there’s usually a right answer. I also loved art. I drew and painted growing up. And then in high school, I took a bunch of art classes. But I think when it came to deciding for college, because I had spent my high school years taking so many math and science classes, I thought, “I am so done. I really don’t want to do this.” Also, my parents are both in science. My dad is a research scientist. My mom is a nurse. I thought, “I don’t want to do what my parents do.”
And so, studying business was kind of like my form of rebellion, like teenage rebellion. Also, because I think I lacked a lot of interpersonal skills and I think, leadership skills and teamwork skills, that’s why I went into business in the first place. But really, the pivot point where I realized that I did not like the prospect of what I would be doing after a business degree was in my junior year internship. I was at an investment bank, and thinking about my career after college. I thought, “Oh no, I do not want to be working nights and weekends.” At the same time, I had started taking computer science classes because I had some free slots in my schedule and CS was something I’d always been interested in, and it just clicked. It just instantaneously clicked and it made so much sense.
Legends: A 3D visualization of the 51 female Noble Laureates and their accomplishments. View
“My parents are both in science. My dad is a research scientist. My mom is a nurse. I thought, “I don’t want to do what my parents do.”
I loved it, in the same way that I loved math. I think when you code, it’s either it works or it doesn’t. It compiles or it does not. It has bugs or it does not. That was so appealing to me that after that internship experience, I thought, “Oh, I don’t think this whole finance path is for me. Let me start concentrating on more of my computer science classes.” And then I started looking for a software engineering role out of university. Luckily, I was hired as a front end developer at a big data company. I think that was actually the second pivotal moment. That was the place where, because it was front end and because it was big data, charts and visualizations were a huge part of my work, and that’s how I was exposed to data visualization in the first place.
That’s when I realized how perfect that field was for me because of my affinity for art and design and also my affinity for math and code, just because when coding data visualizations, there’s actually a lot of geometry and trigonometry that’s involved. I just really loved that whole combination. And then when I went freelance to do data visualization, I realized how much I enjoyed the field. I started out loving it from a technical perspective and now I really appreciate it from an understanding of data. And because there’s just so much data around us now, I really appreciate the skill sets I’ve developed in terms of how to think about data, how to explore data and how to present and communicate with data.
Hear about upcoming conversations:

Bussed Out: How America moves its homeless. View
Do you clearly define your involvement in each new project? Where do you fit in when looking at the span from capturing and organizing data, to visualizing, to maintaining and educating about tool usage?
When I’m doing personal projects, I’ll do everything from start to end. It’s kind of like the Data Sketches book is about the whole process of building a data visualization. Usually, that would entail doing the data collection and then data cleaning, as well as the data analysis, and then taking that and translating it into a design, and then translating that design again into code and then having it for the web. In there, especially in the design process, you interweave the storytelling. So that’s the four aspects that I think of in terms of data visualization—the data, the design, the code and the story. Within that process, how I work with clients is very much tailored to that client. Sometimes that client will say, “We have all of the data ready to go. We just need help designing it.” And so, I’ll come in.
I still prefer to do some of my own analysis so that I have a good, intuitive understanding of the dataset, but I’ll come in mostly from the design and code side and maybe a little bit of support on the story side, never the writing. Again, the writing is like... I’m just too slow at writing.
“I prefer to do the design and the code so that I know exactly the motivation behind the design and I’ve fleshed out all of the edge cases and I can do the implementation.”
But it’s just the outline of the story. A lot of times then, especially if it’s a more difficult, sensitive or serious topic, they’ll have a domain expert that I get to work with, and that’s really great. Other times they might say, “Oh, we just want to show off the product we have.” That might be an API, or they might just have a data set and they say, “Go wild.” I do not do the data collection when it comes to client projects or very rarely do I do the data collection. The closest that comes to it for a client project is if they have an API that they want me to be using to showcase the possibility of what you can do with the data through their API.

Film Flowers: Summer blockbusters reimagined as flowers. An experimentation with color. View
The two rules I do have is that I will not do data collection, just because it takes so long, and especially for some topics, I’m not qualified to. Two, that I will always, always be involved in the design process, because I found that if they already have the design and ask me to do only the implementation process, that’s a less rich experience because then I didn’t know the thought process behind why something was this way, or if I found that an edge case was missing or something. So it really is just that I prefer to do the design and the code so that I know exactly the motivation behind the design and I’ve fleshed out all of the edge cases and I can do the implementation.
That makes sense. If they have the data, are you organizing it and building the data sets to be used or are you telling them what you need to make that happen?
Oftentimes, they’ll already have the dataset built. They will have finished the data collection process. Perhaps the answer is that I think of the data in two parts. There’s their raw data that they’ve collected, and then there is the data format I need for my visualizations. Sometimes they’ll be exactly the same, especially with more straightforward data sets, but oftentimes the way that they collected it might be in a certain format. And then if I decide to make it, let’s say the simplest case, a bar chart, then I need the data to be in a certain format for the bar chart to be able to read it and display it and I’ll often take care of that second part because it doesn’t make as much sense for them to tailor their raw data into what I need, especially because throughout the design process, the format I need would change constantly.
So instead of having that feedback loop of, “Oh, I need it like this,” and then having them change it and “I need it like this,” and them changing it, I just take care of transforming the data into what I need. And then perhaps if this is for a reusable tool, after I hand off the code, I’ll also have documentation about how I transform their data into what I need, and then they’ll be responsible for doing that transformation from there on.

Send Me Love - SFMOMA: An exploration of five individuals and their interactions with Send Me SFMOMA for a week. View
How much of your time is devoted to pure experimentation?
It really depends on the economy, I feel. So let’s say a in pretty normal year, I might try to take on projects for a few months and then give myself a month to do my own things and learn my own things. Or maybe I’ll be taking on one less client project and I’ll have my own personal projects on top at the same time or something. That’s a normal year. A year like last year where the clients went away, in March, I had a lot of time to experiment. And then a busier year, this year is thankfully turning out to be a bit busier, I have a little bit less time for exploration. So I might try to do all of the projects when they come in. And then whenever I can sneak in the time, I’ll do exploration and experimentation. But the Data Sketches project was very much about exploring and learning. We had to complete these projects. And because we weren’t trying to deliver for anyone but ourselves, it was a really great place for learning and experimentation.
“The Data Sketches project was very much about exploring and learning. We had to complete these projects. And because we weren’t trying to deliver for anyone but ourselves, it was a really great place for learning and experimentation.”
Now that that’s over, I think I feel really enriched by the experience of how important it was to have that vehicle. I’m trying to give myself more of that space. Actually, one of the biggest things I realized is that a month here and there is really great for gaining skills that are pretty tangential to what I do, and that the skill gaining doesn’t require too much time. But for things that are bigger and are really outside of my domain expertise, I’ve found it frustrating to try and gain a little bit in a month, then a few months later, almost starting afresh because it’s been so long. And so, I’ve decided to go back to school for a master’s so that I can have a two-year period where I’m just trying to learn and gain new skills. So, that’s now my new way of trying to gain new skills.
hong kong artists, women: Highlighting the work of HK women artists and their under-representation online. View
I hear that you are enrolled in the NYU ITP program. What attracted you to it?
It’s super cool. It has this really awesome, pure, weird maker vibe that I feel has somehow become missing in the whole Silicon Valley “disrupt everything” thing.
It looks incredible. Are you going with any set expectations or are you just falling into it?
Everybody says “Shirley, have some sort of focus.” I really love how my friend put it, “ITP is a very expanding process and not a narrowing process.” I think in a lot of master’s programs, you have a thesis, and it’s very concentrated. You’re there to really hone your skill in one thing. Whereas at ITP, there are so many electives in different areas and you can take so many different classes that it’s really helpful to have a focus going in. For me, I really want to be gaining more hardware and fabrication skills.
I feel pretty confident in my digital and software skills and I really want to flesh out the hardware side so that I can do more data visualizations in different mediums or tell different data stories in different mediums, but I do also want to keep my mind open—I have this focus, but I want to try a lot of different things. The biggest thing for me is I want to go there because I don’t 100% know what I don’t know and I don’t 100% know what I want. So then, I want to be open-minded about new possibilities that I never even knew about.
“I want to be open-minded about new possibilities that I never even knew about.”
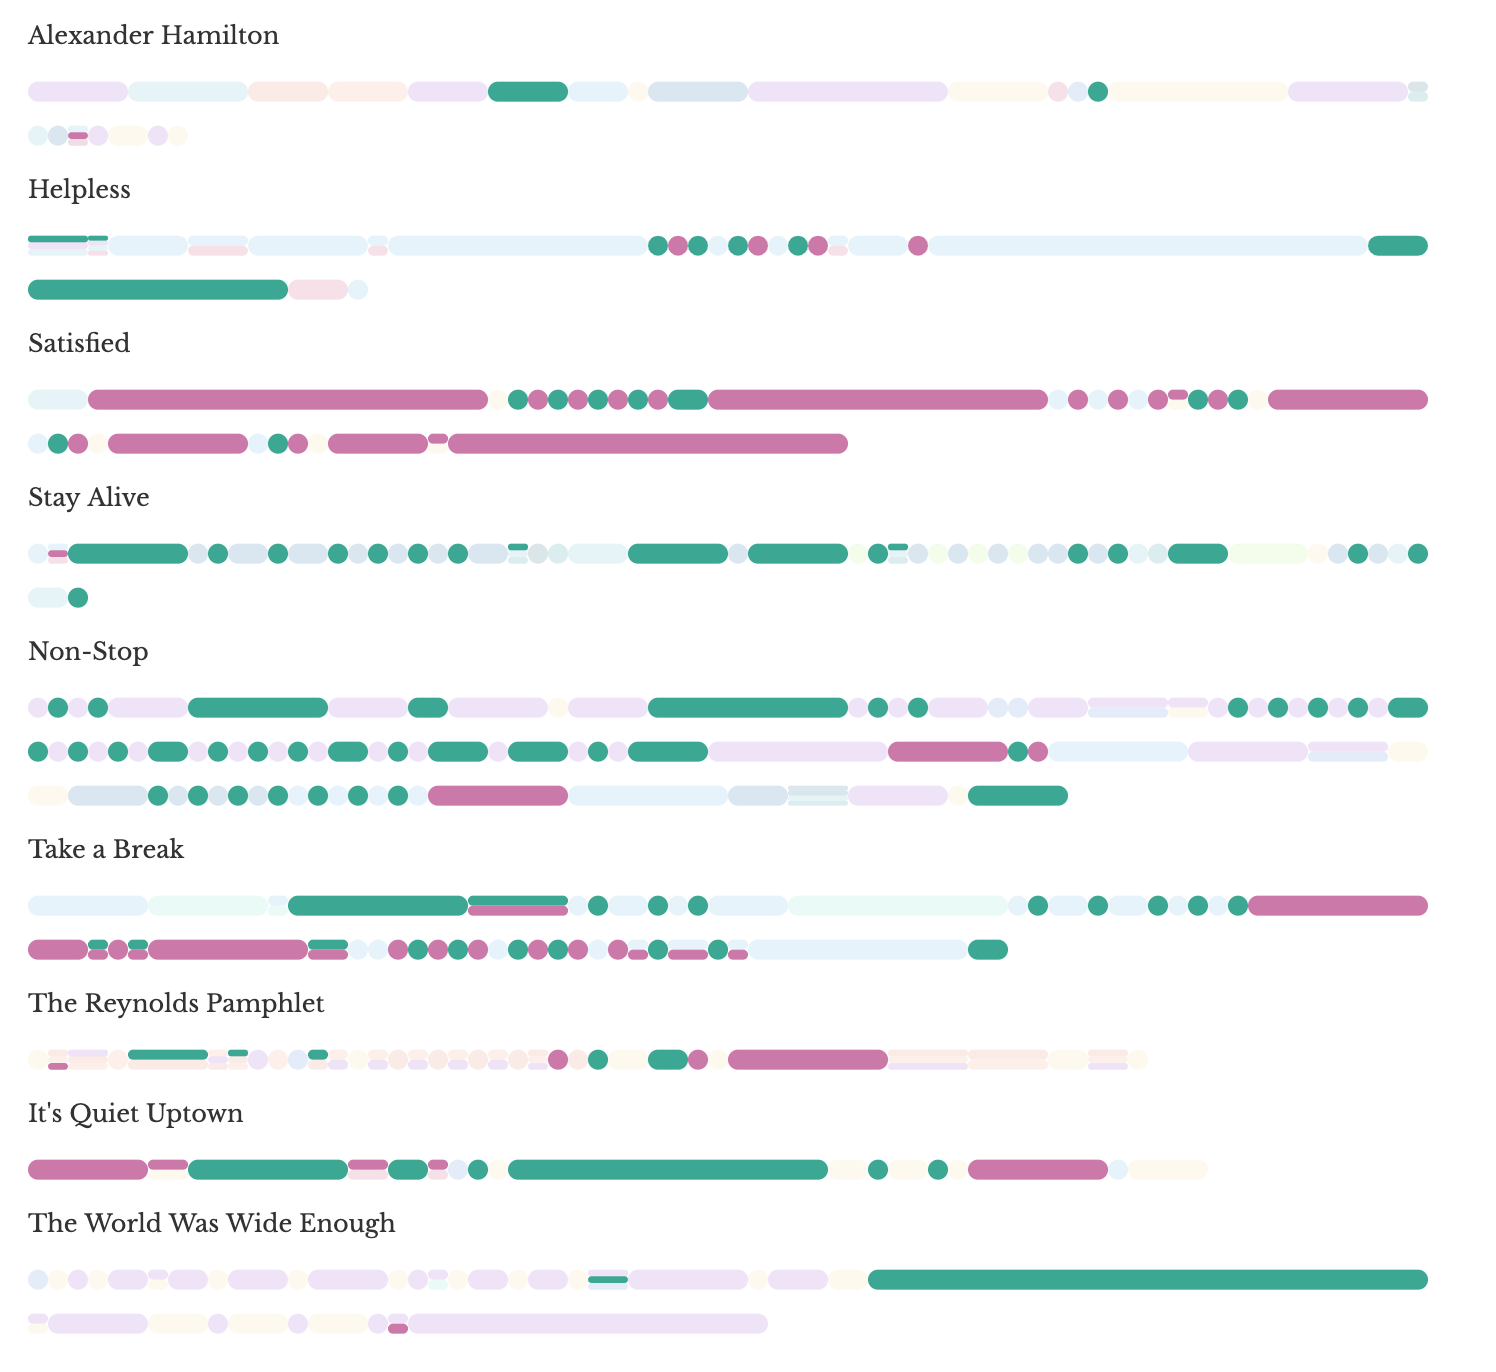
An Interactive Visualization of Every Line in Hamilton: Analyzing 21,000 words for relational and thematic insights. View
Who or where do you look to for inspiration in your work?
A lot of times I’ll go on Pinterest, and because the design phase is where I now have a good understanding of the dataset and what we want to communicate with it. And so I’ll go on Pinterest and search for moods or whatever it is that we’re trying to communicate. Instead of trying to find visualizations as inspiration, I’ll try and find moods or whatever that topic might be.
So if a topic is about, I don’t know, computer chips, I’ll just type computer chips into Pinterest and see what comes up. And then, usually, I’ll get inspired by a shape I see or a color scheme or some sort of a layout, and that’s what informs my design. I try not to look at other data visualizations because I don’t want to copycat them—instead I look at things in nature or other people’s artwork. And then I’ll ask a lot of my data viz friends for feedback once I have a good design prototype implemented.
I think one of the greatest pieces of advice I got when I first starting to freelance was just having someone that’s in a similar space, going through a similar journey as you. Especially as a freelancer, it’s such a... What’s the word? Not reclusive, but it’s such a lonely experience sometimes. It helps to have someone to have that check-in with because we don’t have the weekly stand-ups or anything, so then our check-in is that weekly standup for us.

How do you stay on top of new technologies in design and visualization?
The front-end development ecosystem is very quick moving. I actually actively try not to pay too much attention to new things because there’s so many new things.
If I try to keep up with every new thing in web dev, I would just be overwhelmed. And so, when I see people’s works that really resonate, I might look into what tools they used. Other than that, I’m very grateful that I now have a lot of people that enjoy my work and they might say, “Shirley, you might actually enjoy this JavaScript library or you might want to look into this.” I think that’s usually how I find out about new things. Someone might tell me on Twitter or I’ll see something on Twitter or I knew my friends in the same field might say, “You should be aware of this.” Thankfully, I’m more passive about it. Then if it aligns with me, I’ll eventually find out about it.
“I definitely separate and time-box when I’m a consumer of other people’s work versus when I’m producing my own work.”
Do you ever feel overwhelmed by new technologies and approaches? Is there such a thing as trying to learn too much?
My friend says something interesting about how we have both producer and consumer modes when we are producing our own work or consuming other people’s work. So, I see it in two ways. With data visualization, it’s a lot of learning new topics because to visualize a dataset, that dataset is some sort of topic. And so, it can get pretty overwhelming sometimes to learn new things. Thankfully, I tried to take on bigger projects, where the turnaround is every few months instead of every few weeks so that the learning happens every few months, but even then it can get a little bit overwhelming, but I really enjoy learning new topics.
When it comes to new technologies or keeping up with other people’s work or their thoughts, I actually try not to pay too much attention to new tech. I try, especially when I’m in the producing cycle, to not to look at other people’s work because I think it really gets into my head when I see other people’s work and I feel like I might unconsciously copy them or something. So I think it’s in-between the producer timelines when I’ll actively go out and seek other people’s work in the same field that I can then be inspired by and I’ll pull those into my Pinterest and bookmark them or something and think, “Whoa, this is cool. This is what’s happening now.” But I think I definitely separate and time-box when I’m a consumer of other people’s work versus when I’m producing my own work.
To learn more about Shirley Wu and her work, visit
and datasketch.es